CAT Score Vs Percentile estimates Scores required for 99, 95, 90 and other Percentiles. After release of CAT answer key and response sheet on December 4, MBAUniverse.com has compiled revised CAT Score Vs Percentile 2025 estimates by India’s Top CAT Coaching institutes. Revised CAT 2025 Score Vs Percentile by IMS Coaching (shared on Dec 5) show big changes: To get 99% in Slot 1 (Tougher), DILR and QA marks are revised sharply down (−7, −4) while VARC moves up (+2). Slot 2 was Easier & Stable (Not much change) but in Slot 3 (Tougher), QA and DILR marks are significantly revised down (−8, −5) while VARC jumps up (+4). Career Launcher CL CAT Score Vs Percentile 2025 estimates are: To get 99.5 %, CAT Scaled Score of 88–89 is required and for 99 %, score of 79 is required. Cracku Founder Maruti Kandori has released Cracku CAT Score Vs Percentile 2025 and said, “DILR Section is the Game Changer in CAT 2025”. Estimates by Arun Sharma, Rajesh Sir (2IIM) and others are also published below. Read complete analysis and scores required for 99.5%, 95%, 90%, 85%, 80%, 70% in the article below.
Which is Most Accurate Predictor? To convert raw scores into likely percentile, students rely on “Predictors” by IMS, CL, TIME, Cracku and others. However, after trying many of them, students are left confused as their estimates are quite different! To give clarity to students, MBAUniverse.com compared actual student data of CAT 2025 Predictions by CL, Cracku, IMS, and TIME. Our analysis indicate that one predictor is overly optimistic, while other seems too conservative, and there is big divergence in lower end of percentiles. Overall, IMS Coaching Predictor seems most balanced. Check detailed comparison data in this article.
Latest Update: CAT exam was successfully held on Nov 30, and result was released on Dec 24, 2025. Check IIM JAP 2026, MBA Admissions 2026, MBA Entrance Exams 2026, Top MBA Colleges Accepting CAT 2025 Score and Top MBA Colleges in India 2026.
Before we discuss the latest CAT Score Vs Percentile 2025 Slot Wise estimates by India’s Top CAT Coaching companies, you should understand the What and How of CAT Score and Percentile calculation process. This section explains how IIM CAT converts candidate’s responses (answer sheet) into raw scores, applies normalization, calculates scaled scores, assigns ranks, and finally assigns percentiles. Read step-by-step guide to understand how IIMs conduct CAT Score Vs Percentile calculation process and generate your CAT scorecard.
Step 1: Response Evaluation
In this step, the candidate’s answers for the VARC, DILR, and QA sections are checked against the CAT official answer key. Each response is classified as correct, incorrect, or a TITA (type-in-the-answer) response. No marks are assigned at this stage. The purpose here is only to identify the accuracy (correct, wrong, un attempted) of each response so that the scoring rules can be applied correctly in the next step.
Step 2: Raw Score Calculation
After the responses are evaluated for all candidates, the raw score for each section is calculated using the official CAT marking scheme. For every correct answer, the candidate is awarded +3 marks. For each incorrect MCQ, –1 mark is deducted, while TITA (non-MCQ) questions do not carry negative marking even if the answer is wrong. This process is applied separately to VARC, DILR, and QA for each candidate to produce the “CAT raw section-wise scores”, which form the basis for applying CAT normalization process.
Step 3: Slot-wise, Section-wise Normalization Process
Since CAT is conducted in three shifts with totally different question papers, the level of difficulty can vary slightly across slots. To ensure fairness to all candidates, the raw scores obtained by the candidate in each section (VARC, DILR, and QA) are adjusted using a statistical CAT normalization process. This process adjusts the CAT scores for all candidates for all slots by considering factors such as the mean and distribution of scores in each slot. Read more about CAT normalization process in the following section. The result of this step is the scaled score for each section, which allows scores from different slots to be compared on a common scale.
Step 4: Overall Scaled Score Calculation
Once the scaled scores for VARC, DILR, and QA for all candidates are obtained, they are added together to determine the candidate’s overall scaled score. This score represents the candidate’s performance across all three sections on a common, normalized scale. This CAT Scaled Score gives a fair comparison for all candidates, which is adjusted for difficulty level. This CAT overall scaled score is used for ranking candidates, and is the basis for calculating the percentile as explained in the next step.
Step 5: Ranking of Candidates
After the CAT overall scaled scores are calculated for all candidates, they are ranked in descending order based on these scores. The candidate with the highest overall scaled score is assigned the top rank, followed sequentially by others. This ranking reflects each candidate’s performance relative to all others who appeared for the exam for all the three slots. This rank is used for calculating the percentile in the next step.
Step 6: Percentile Calculation
In the sixth and final step, once the ranks are assigned, the percentile is calculated to indicate the candidate’s relative performance among all CAT test-takers. The CAT percentile shows the percentage of candidates who scored less than or equal to the candidate. It is derived using the candidate’s rank and the total number of candidates who took the exam. Percentiles are computed section-wise and overall, and these percentiles are the final values reported on the CAT scorecard.
Check Latest CAT 2025 Score vs Percentile Estimates by India’s Top CAT Experts in the article below (Updated on Dec 5).
Table 1: CAT Score Vs Percentile 2025 Calculation Process
No. | Step | Explanation | Outcome |
|---|---|---|---|
1 | CAT Response Evaluation | Candidate’s answers in all sections are checked against the official answer key and classified as correct, incorrect, or TITA. | Response classification completed for each question. |
2 | CAT Raw Score Calculation | The CAT marking scheme is applied. Raw scores are computed separately for VARC, DILR, and QA. | Raw section-wise scores for VARC, DILR, QA. |
3 | CAT Section-wise Normalization | Raw scores are statistically adjusted (normalized) to account for differences in difficulty across exam slots. | Scaled section wise scores for VARC, DILR, QA. |
4 | CAT Overall Scaled Score Calculation | The scaled scores of all three sections are added together. | Overall scaled score for each candidate. |
5 | Ranking of Candidates | Candidates are arranged in descending order based on their overall scaled score. | Rank assigned to each candidate. |
6 | CAT Percentile Calculation | Percentile is calculated to show the percentage of candidates who scored less than or equal to the candidate, computed both section-wise and overall. | Sectional percentile and Overall percentile displayed on scorecard. |
Check (Latest) CAT 2025 Score vs Percentile Estimates by India’s Top CAT Experts & Comparison of Results from Different Predictors in the Article below.
Download Top MBA Colleges Accepting CAT 2025 Score (Fees, Placements) PDF
As explained in step 3 above, since CAT is conducted in three shifts with totally different question papers, the level of difficulty can vary slightly across slots. To ensure fairness to all candidates, the raw scores obtained by the candidate in each section (VARC, DILR, and QA) are adjusted using a statistical CAT normalization process. This process adjusts the CAT scores for all candidates for all slots by considering factors such as the mean and distribution of scores in each slot. The result of this step is the scaled score for each section, which allows scores from different slots to be compared on a common scale. Check complete details in the image below that is the explanation of official CAT Normalization Process.
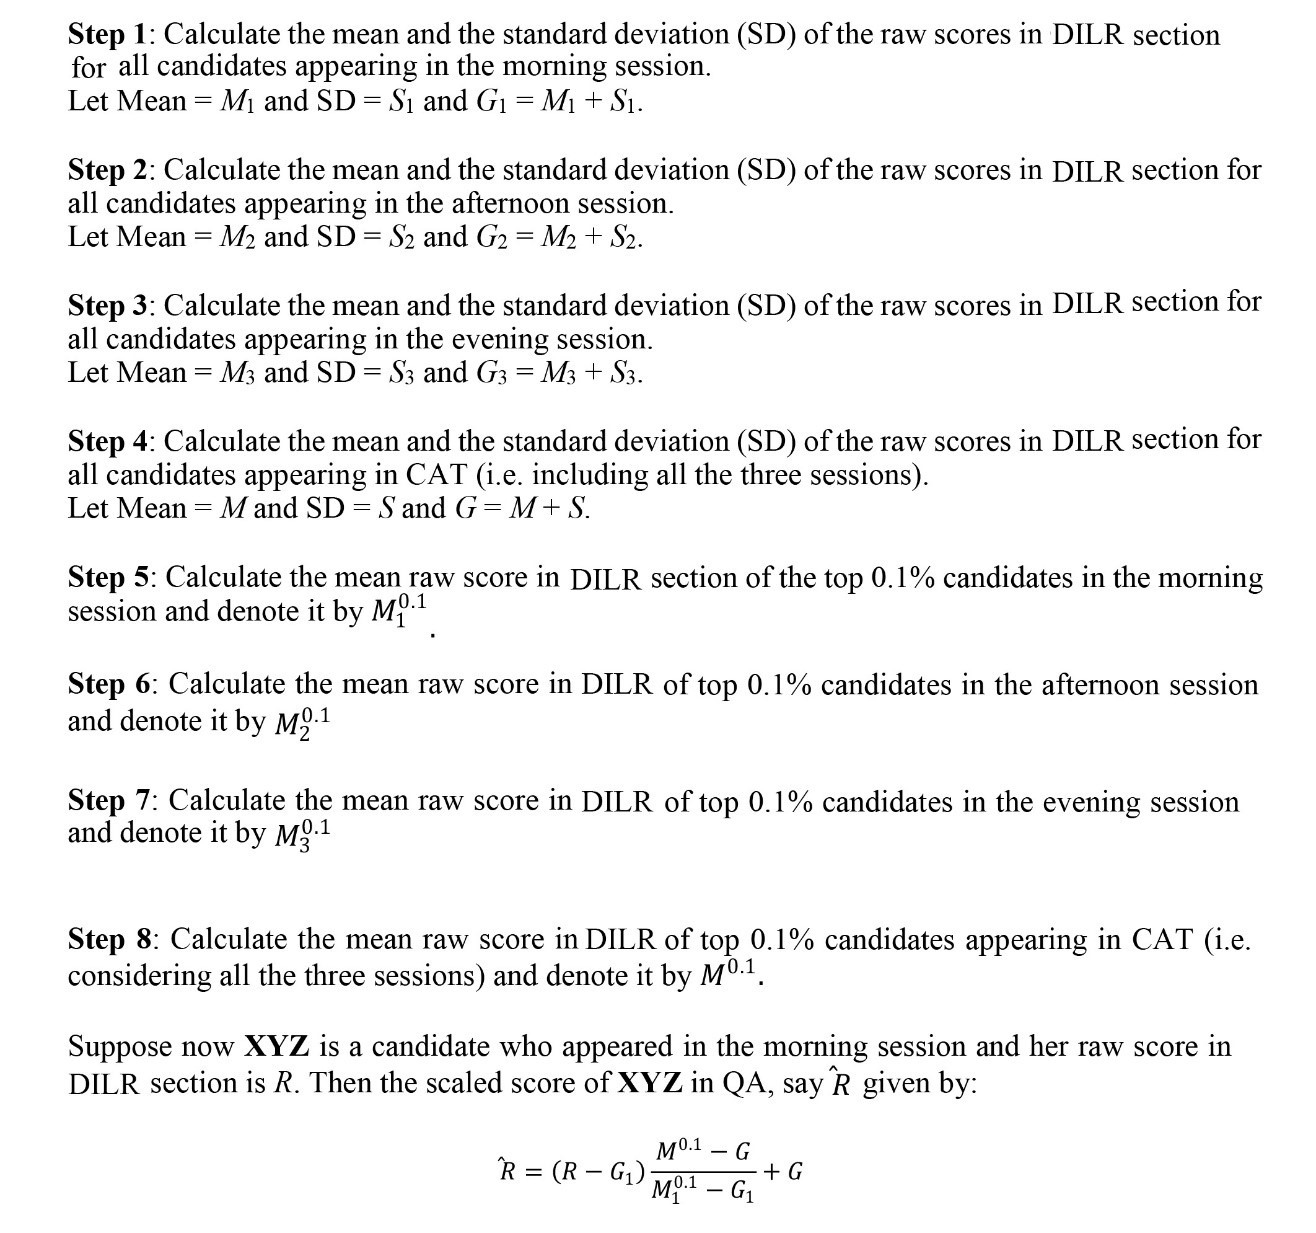
Source: IIM Calcutta
Check (Latest) CAT 2025 Score vs Percentile Estimates by India’s Top CAT Experts & Comparison of Results from Different Predictors in the Article below.
Download Top MBA Colleges Accepting CAT 2025 Score (Fees, Placements) PDF
As described in step 6 above, CAT percentile is calculated to show the percentage of candidates who scored less than or equal to the candidate, computed both section-wise and overall. Read this detailed explanation of how CAT percentile is calculated.
Percentile in CAT exam is calculated by taking into account the total number of candidates who appeared for CAT in all the 3 slots. Each candidate is assigned a rank based on scaled score and if more than one candidate obtains same scaled scores, same percentile is assigned to them. Following Process is followed to arrive at CAT percentile score:
Check (Latest) CAT 2025 Score vs Percentile Estimates by India’s Top CAT Experts & Comparison of Results from Different Predictors in the Article below.
Download Top MBA Colleges Accepting CAT 2025 Score (Fees, Placements) PDF
It can be seen from the above discussions, CAT exam paper difficulty level will have a direct impact on CAT Score Vs Percentile outcomes. A detailed analysis of CAT exam difficulty level by MBAUniverse.com reveals that IIMs balance paper difficulty level across years. If a section of the paper was easy in a given year, the next year become more difficult. However, if a section of the CAT paper was very difficult in once year, it generally becomes earlier the next year. Specifically, in 2023, under IIM Lucknow, both DILR and QA sections were rated difficult to very difficult, resulting in an overall tough paper. In fact according to CAT experts like Arun Sharma, author of bestselling CAT books, CAT 2023 paper was one of the toughest CAT papers in last 10 years. Next year, to balance a very difficult paper, CAT 2024 paper was set to be one of the easiest papers in last 10 years.
Following this cycle, CAT 2025 was expected to have a higher level of difficulty than CAT 2024 paper. That’s exactly how CAT 2025 paper turned out. Experts from IMS, CL, and other CAT experts agree that CAT 2025 exam paper difficulty level was higher than CAT 2024, but lower than CAT 2023. Check table 2 below for more details.
Table 2: CAT Exam Paper 2025 Difficulty Level: Expectation & Prediction
Year | IIM | VARC | DILR | QA | Overall |
|---|---|---|---|---|---|
2023 | IIM Lucknow | Moderate | Difficult | Difficult | Difficult |
2024 | IIM Calcutta | Moderate | Easy | Moderate | Easy |
2025 | IIM Kozhikode | Moderate (expected) | Moderate/ Difficult (expected) | Moderate (expected) | Moderate (expected) |
2025 | IIM Kozhikode | Moderate | Difficult | Moderate | Moderate |
Source: MBAUniverse.com
Download Top MBA Colleges Accepting CAT 2025 Score (Fees, Placements) PDF
So, how does the difficulty level impact the score vs percentile? MBAUniverse.com did an analysis of CAT score vs percentile last 5 years data -- from 2021 to 2024 to answer this question. In CAT 2024, candidates needed around 125 marks for the 99.9 percentile, significantly higher than the 100 marks required in CAT 2023, confirming that CAT 2023 was considerably tougher. A similar trend is seen across other percentiles. For instance, the 99 percentile required 95 marks in 2024 compared to only 77 in 2023. This consistent inverse relationship between difficulty level of CAT exam paper and the scores required to score high percentages indicates that even small changes in paper difficulty level can cause large shifts in percentile cut-offs. Check CAT score Vs Percentile 2023, CAT score vs percentile 2022 and CAT score vs percentile 2021 in table 3 for CAT Score Vs Percentiles previous years trends.
Table 3: CAT Score Vs Percentile: Previous Year’s Trends by MBAUniverse.com
Percentile | CAT 2024 | CAT 2023 | CAT 2022 |
|---|---|---|---|
99.9 | 125 | 100 | 108 |
99.5 | 103 | 85 | 91 |
99 | 95 | 77 | 84 |
95 | 70 | 55 | 61 |
90 | 60 | 44 | 49 |
80 | 45 | 36 | 36 |
70 | 25 | 28 | 30 |
Source: MBAUniverse.com
Check (Latest) CAT 2025 Score vs Percentile Estimates by India’s Top CAT Experts & Comparison of Results from Different Predictors in the Article below.
CAT PREVIOUS YEAR PAPER – CAT 2024 SLOT 3
After understanding the What and How of CAT Score and Percentile calculation process, lets discuss the latest CAT Score Vs Percentile 2025 Slot Wise estimates by India’s Top CAT Coaching.
CAT 2025 exam was held on November 30, 2025. CAT 2025 Answer Key was released on December 4, 2025. Accordingly, updated and latest CAT Score Vs Percentile 2025 Slot Wise estimates by India’s Top CAT Coaching companies like IMS, Cracku, CL, Arun Sharma (CAT books author), Rajesh Balasubramanian (2IIM) and others are published below. This will help you to estimate your likely percentile. Here are the key highlights:
Check complete details in the table and the sections below.
Comparison of CAT Score vs Percentile by India’s Top CAT Institutes (Updated on Dec 5)
Percentile | IMS Slot 1 | IMS Slot 2 | IMS Slot 3 | Career Launcher (CL) – All Slots | Arun Sharma - All Slots | Rajesh Balasubramanian (2IIM) – All Slots |
|---|---|---|---|---|---|---|
99.9%ile | 122 | 115 | 119 | - | 115 | 113 |
99.5%ile | 103 | 97 | 101 | - | 97-98 | 95 |
99%ile | 90 | 83 | 86 | 82-83 | 82 | 84 |
95%ile | 70 | 65 | 65 | 65-67 | 62-63 | 63 |
90%ile | 53 | 51 | 51 | 52-53 | 50-51 | 52 |
85%ile | 45 | 41 | 43 | 45 | 40-41 | - |
80%ile | 40 | 37 | 37 | 40 | 35-36 | 40 |
Source: MBAUniverse.com analysis of data from respective institutes/experts
CAT Marks Vs Percentile 2025 Comparison
Based on above table, CAT Marks Vs Percentile 2025 estimates are as below:
After this comparison of CAT Score vs Percentile by India’s Top CAT Institutes, lets discuss the detailed predictions by each of India’s Top CAT Coaching Institute.
Download Top MBA Colleges Accepting CAT 2025 Score (Fees, Placements) PDF
Cracku Founder Maruti Kandori has share Slot wise Normalization and Scaling Pattern and said that “DILR Section is the Game Changer in CAT 2025 and will see a lot of scaling and normalization.”
Cracku has released following CAT 2025 Score Vs Percentile estimates on December 5, 2025.
Cracku CAT Score vs Percentile 2025 – Slot 1 (Released on December 5, 2025)
Percentile | VARC | LRDI | Quant | Overall |
|---|---|---|---|---|
99.9 | 53 | 36 | 42 | 112 |
99.5 | 42 | 30 | 32 | 95 |
99 | 38 | 24 | 28 | 84 |
95 | 28 | 20 | 22 | 63 |
90 | 22 | 17 | 16 | 52 |
80 | 16 | 14 | 13 | 41 |
70 | 13 | 12 | 11 | 32 |
60 | 10 | 10 | 9 | 25 |
50 | 7 | 7 | 6 | 20 |
Cracku CAT Score vs Percentile 2025 – Slot 2 (Released on December 5, 2025)
Percentile | VARC | LRDI | Quant | Overall |
|---|---|---|---|---|
99.9 | 52 | 34 | 40 | 109 |
99.5 | 41 | 28 | 31 | 94 |
99 | 37 | 23 | 27 | 82 |
95 | 27 | 19 | 21 | 61 |
90 | 21 | 16 | 15 | 51 |
80 | 15 | 13 | 13 | 40 |
70 | 12 | 11 | 11 | 30 |
60 | 9 | 9 | 9 | 24 |
50 | 7 | 6 | 6 | 19 |
Cracku CAT Score vs Percentile 2025 – Slot 3 (Released on December 5, 2025)
Percentile | VARC | LRDI | Quant | Overall |
|---|---|---|---|---|
99.9 | 52 | 35 | 37 | 107 |
99.5 | 41 | 29 | 29 | 93 |
99 | 37 | 24 | 25 | 81 |
95 | 27 | 19 | 19 | 60 |
90 | 21 | 16 | 14 | 50 |
80 | 15 | 13 | 12 | 39 |
70 | 12 | 11 | 10 | 31 |
60 | 9 | 9 | 8 | 24 |
50 | 7 | 6 | 6 | 19 |
Source: Cracku Website
Download Top MBA Colleges Accepting CAT 2025 Score (Fees, Placements) PDF
IMS Coaching has published the most detailed CAT 2025 Score Vs Percentile Estimates for the benefit of CAT 2025 aspirants. The Revised CAT Score Vs Percentile by IMS Coaching (shared with MBAUniverse.com on Dec 5, 6.30 PM) show big changes: To get 99% in Slot 1 (Tougher), DILR and QA marks are revised sharply down (−7, −4) while VARC moves up (+2). In Slot 2 (Easier & Stable), DILR and QA marks are revised up (+3, +1) , and in Slot 3 (Tougher), QA and DILR marks are significantly revised down (−8, −5) while VARC jumps up (+4). Read complete analysis and scores required for 99.5%, 95%, 90%, 85%, 80%, 70% and other insights below.
DILR Section: IMS Revised CAT 2025 Score Vs Percentile - Initial vs Revised Estimates (Raw Score Needed for Percentile)
Percentile | Initial Estimate (Slot 1 / 2 / 3) | Revised Estimate (Slot 1 / 2 / 3) | Difference (Revised – Initial) |
|---|---|---|---|
99.9 | 46 / 42 / 44 | 37 / 46 / 35 | ↓9 / ↑4 / ↓9 |
99.5 | 39 / 35 / 37 | 30 / 37 / 30 | ↓9 / ↑2 / ↓7 |
99 | 34 / 30 / 32 | 27 / 33 / 27 | ↓7 / ↑3 / ↓5 |
98 | 31 / 27 / 29 | 24 / 29 / 25 | ↓7 / ↑2 / ↓4 |
95 | 26 / 23 / 24 | 19 / 24 / 21 | ↓7 / ↑1 / ↓3 |
90 | 19 / 17 / 18 | 15 / 19 / 18 | ↓4 / ↑2 / 0 |
85 | 15 / 13 / 15 | 13 / 15 / 16 | ↓2 / ↑2 / ↑1 |
80 | 13 / 11 / 12 | 11 / 13 / 15 | ↓2 / ↑2 / ↑3 |
75 | — | 9 / 11 / 14 | — |
VARC Section: IMS Revised CAT 2025 Score Vs Percentile - Initial vs Revised Estimates (Raw Score Needed for Percentile)
Percentile | Initial Estimate (Slot 1 / 2 / 3) | Revised Estimate (Slot 1 / 2 / 3) | Difference (Revised – Initial) |
|---|---|---|---|
99.9 | 51 / 52 / 53 | 51 / 50 / 55 | 0 / ↓2 / ↑2 |
99.5 | 44 / 45 / 46 | 45 / 44 / 49 | ↑1 / ↓1 / ↑3 |
99 | 40 / 41 / 41 | 42 / 40 / 45 | ↑2 / ↓1 / ↑4 |
98 | 34 / 36 / 34 | 38 / 36 / 40 | ↑4 / 0 / ↑6 |
95 | 30 / 32 / 30 | 32 / 30 / 33 | ↑2 / ↓2 / ↑3 |
90 | 23 / 25 / 23 | 27 / 25 / 28 | ↑4 / 0 / ↑5 |
85 | 19 / 20 / 19 | 23 / 22 / 24 | ↑4 / ↑2 / ↑5 |
80 | 17 / 18 / 17 | 21 / 19 / 21 | ↑4 / ↑1 / ↑4 |
75 | — | 19 / 17 / 18 | — |
Quant (QA): IMS Revised CAT 2025 Score Vs Percentile - Initial vs Revised Estimates (Raw Score Needed for Percentile)
Percentile | Initial Estimate (Slot 1 / 2 / 3) | Revised Estimate (Slot 1 / 2 / 3) | Difference (Revised – Initial) |
|---|---|---|---|
99.9 | 48 / 43 / 45 | 41 / 40 / 35 | ↓7 / ↓3 / ↓10 |
99.5 | 40 / 35 / 37 | 33 / 33 / 28 | ↓7 / ↓2 / ↓9 |
99 | 33 / 28 / 30 | 29 / 29 / 25 | ↓4 / ↑1 / ↓5 |
98 | 30 / 25 / 27 | 25 / 26 / 22 | ↓5 / ↑1 / ↓5 |
95 | 25 / 20 / 23 | 20 / 21 / 17 | ↓5 / ↑1 / ↓6 |
90 | 18 / 15 / 17 | 15 / 17 / 13 | ↓3 / ↑2 / ↓4 |
85 | 16 / 13 / 14 | 13 / 15 / 13 | ↓3 / ↑2 / ↓1 |
80 | 14 / 12 / 12 | 10 / 13 / 10 | ↓4 / ↑1 / ↓2 |
75 | — | 9 / 12 / 8 | — |
Overall Summary of Revisions (VARC, DILR, QA) by IMS
1. VARC – Revisions Indicate Sections Were Easier Than First Estimated
2. DILR – Strong Recalibration: Slot 1 Much Tougher, Slot 2 Easier
3. QA – Large Downward Corrections for Slot 1 and Slot 3
Download Top MBA Colleges Accepting CAT 2025 Score (Fees, Placements) PDF
Career Launcher (CL) is a leading CAT coaching institute. CL Vice Chairman Gautam Puri is IIM-Bangalore alumnus and recognized as one of India’s top CAT mentors. Here are CL CAT 2025 Score vs Percentile Estimates.
Career Launcher (CL) Initial Estimates - CAT 2025 Percentile vs Score (30th Nov)
SLOT 1
Percentile | VARC | DILR | QA | Overall |
|---|---|---|---|---|
99 | 40 | 26 | 28 | 81 |
95 | 33 | 19 | 21 | 65 |
90 | 25 | 16 | 18 | 52 |
85 | 23 | 13 | 14 | 45 |
80 | 21 | 12 | 13 | 40 |
SLOT 2
Percentile | VARC | DILR | QA | Overall |
|---|---|---|---|---|
99 | 40 | 27 | 30 | 82–83 |
95 | 33 | 19 | 22 | 66 |
90 | 25 | 16 | 20 | 53 |
85 | 23 | 13 | 14 | 45 |
80 | 21 | 12 | 13 | 40 |
SLOT 3
Percentile | VARC | DILR | QA | Overall |
|---|---|---|---|---|
99 | 42 | 27 | 28 | 83–84 |
95 | 33 | 20 | 22 | 67 |
90 | 25 | 16 | 20 | 53 |
85 | 23 | 13 | 14 | 45 |
80 | 21 | 12 | 13 | 40 |
Source: Career Launcher
Revised CL CAT 2025 Score vs Percentile Estimates (December 5, 2025)
On December 5, 2025, revised CL CAT 2025 Score vs Percentile Estimates were shared, as below. Candidates must note that these estimates based on Scaled Scores for all the three slots, and not Raw Score.
Percentile | Marks in CAT 2025 |
|---|---|
99.9 | Not Released |
99.5 | 88–89 |
99 | 79 |
95 | 54–55 |
90 | 44–45 |
80 | 31–32 |
Source: Career Launcher
Download Top MBA Colleges Accepting CAT 2025 Score (Fees, Placements) PDF
Different test-prep institutes use their own data models to estimate how raw CAT scores convert to percentiles. As a result, students often see varying predictions for the same score across CL, Cracku, IMS, and TIME. To understand these differences better, we analysed multiple score–percentile pairs across all three slots. The table below compiles real student’s CAT 2025 score vs percentile data across Slots 1, 2 and 3, showing how each predictor maps raw scores to estimated percentiles. The data is from MBAUniverse.com readers who submitted their data for this analysis. This comparison highlights both the consistency and variation in predictions, and provides a clearer picture of how each institute interprets data. After the CAT 2025 result is out, MBAUniverse.com will update this table and publish actual percentile achieved by each student. This will help us answer the question - Which is the Most Accurate CAT 2025 Score vs Percentile Predictor?
Table: Comparing CAT 2025 Score vs Percentile Predictions by CL, Cracku, IMS, and TIME (Slots 1, 2, 3)
Slot | Raw Score | CL | Cracku | IMS | TIME |
|---|---|---|---|---|---|
| 1 | 92 | 99.7 | 99.55 | 99.65 | |
| 1 | 89 | 99.62 | 99.52 | 99.63 | 99.55 |
1 | 61 | 97.57 | 94.63 | 94.56 | - |
1 | 57 | 96.32 | 92.32 |
|
|
1 | 54 | 95.33 | 89.26 |
|
|
1 | 52 | 95 | 90.5 |
|
|
1 | 44 | 92.8 |
| 81.61 |
|
1 | 44 | 92 | 87 |
|
|
1 | 41 | 92 | 82 |
|
|
| 1 | 36 | 87.16 | 79.69 | 77.74 | 77.83 |
1 | 33 | 86.2 | 70.8 |
|
|
2 | 69 | 97.77 | 94.6 | 96.7 | 96.07 |
2 | 60 | 96.3 | 92.3 |
|
|
| 2 | 64 | 96.77 | 93.25 | 95.32 | |
2 | 55 | 95 | 89 | 88 |
|
2 | 54 | 94.5 | 88 |
|
|
2 | 48 | 91.2 | 84.51 |
|
|
2 | 45 | 89.5 | 81 | 84.54 | 82.69 |
2 | 35 | 88.5 | 80 |
|
|
3 | 79 | 98.7 | 97.61 | 98.1 | 98 |
3 | 76 | 98 | 96.8 | 98 |
|
3 | 65 | 97.5 | 94.5 |
|
|
3 | 64 | 96.97 | 92.49 | 95.1 |
|
3 | 63 | 96 | 91.44 | 93.5 |
|
3 | 62 | 96.23 | 91.43 | 92.13 | 94.6 |
3 | 58 | 94 | 88 | 93 |
|
3 | 56 | 95.31 | 89.63 | 93.14 |
|
3 | 54 | 95 | 90 |
|
|
3 | 53 | 94.47 | 87.89 | 90.5 |
|
3 | 50 | 94.56 | 86.6 | 93.22 |
|
3 | 50 | 93.34 | 85.5 |
|
|
3 | 42 | 85.7 | 75 | 73 | 79 |
3 | 40 | 86.67 | 76.4 | 78 |
|
3 | 37 | 83 | 65 | 76 |
Comparing CAT 2025 Score vs Percentile by CL, Cracku, IMS, TIME: Observations
Download Top MBA Colleges Accepting CAT 2025 Score (Fees, Placements) PDF
Rajesh Balasubramanian CAT 2025 Score vs Percentile Estimates (Updated on December 1)
Rajesh Balasubramanian is the Founder of 2IIM and Indian Institute of Management Bangalore alumnus. Here are his predictions on the CAT exam day.
Percentile | VARC | DILR | Quant | Overall |
|---|---|---|---|---|
99.9 | 52 | 41 | 50 | 113 |
99.5 | 46 | 34 | 39 | 95 |
99 | 40 | 25 | 33 | 84 |
95 | 31 | 20 | 25 | 63 |
90 | 24 | 14 | 17 | 52 |
80 | 18 | 11 | 12 | 40 |
60 | 12 | 7 | 9 | 25 |
Arun Sharma is author of best selling CAT coaching books and founder of Mindworkzz Coaching. Here are his predictions. Here are his predictions on the CAT exam day.
Percentile | Marks |
|---|---|
99.6–99.7 | 100 |
99.1 | 85 |
99 | 82 |
98 | 74 |
95 | 62–63 |
90 | 50–51 |
85 | 35–37 |
Based on Admission Policies of IIMs and other top B-schools like MDI and SPJIMR, CAT Expected score vs percentile 2025 for top B-schools will be published in coming days.
Based on Admission Policies of IIMs and other top B-schools like MDI and SPJIMR, CAT Expected score vs percentile 2025 for top B-schools will be published in coming days.
Download Top MBA Colleges Accepting CAT 2025 Score (Fees, Placements) PDF
For your reference, last year CAT score vs percentile estimates for all sections and slots by IMS Coaching are given below. CAT score vs percentile section wise for previous years is also given below.
CAT 2024 Score vs Percentile Slot 1
Percentile | VARC Score | DILR Score | QA Score | Overall |
|---|---|---|---|---|
99.9 | 48 | 49 | 48 | 120-124 |
99.5 | 40 | 43 | 43 | 106-110 |
99 | 36 | 40 | 35 | 95-98 |
98 | 25 | 33 | 24 | 71-74 |
95 | 20 | 29 | 18 | 59-61 |
90 | 17 | 23 | 14 | 50-51 |
85 | 15 | 21 | 13 | 46-47 |
80 | 13 | 19 | 11 | 41-42 |
75 | 12 | 16 | 10 | 36-37 |
Source: IMS Learning
CAT 2024 Score vs Percentile Slot 2
Percentile | VARC Score | DILR Score | QA Score | Overall |
|---|---|---|---|---|
99.9 | 50 | 46 | 46 | 118-123 |
99.5 | 42 | 40 | 41 | 103-108 |
99 | 38 | 37 | 33 | 92-95 |
98 | 28 | 30 | 22 | 69-72 |
95 | 23 | 27 | 16 | 57-59 |
90 | 20 | 21 | 13 | 47-49 |
85 | 18 | 19 | 12 | 42-44 |
80 | 15 | 17 | 10 | 39-40 |
75 | 14 | 14 | 9 | 34-36 |
Source: IMS Learning
CAT 2024 Score vs Percentile Slot 3
Percentile | Score VA-RC | Score DI-LR | Score QA | Overall Score |
|---|---|---|---|---|
99.9 %ile | 48 | 46 | 48 | 118-123 |
99.5 %ile | 40 | 40 | 43 | 103-108 |
99 %ile | 36 | 37 | 35 | 92-95 |
98 %ile | 25 | 30 | 24 | 68-71 |
95 %ile | 19 | 27 | 18 | 55-57 |
90 %ile | 16 | 21 | 14 | 45-47 |
85 %ile | 14 | 19 | 13 | 39-42 |
80 %ile | 12 | 17 | 11 | 36-38 |
75 %ile | 11 | 14 | 10 | 32-34 |
Source: IMS Learning
Download Top MBA Colleges Accepting CAT 2025 Score (Fees, Placements) PDF
Now that you know the expected CAT 2025 score vs Percentile, check CAT 2025 Percentile Predictor, a free online tool to calculate your marks and percentile in CAT exam based on your actual (or expected) performance in the CAT exam. This tool works as both CAT Marks Calculator 2025 and CAT Percentile Calculator 2025. Hence it is a CAT score vs percentile calculator 2025. The tool uses the same methodology used by IIMs (explained above) to calculate Score and Percentile.
In summary, CAT 2025 Percentile vs Score defines the relationship between a candidate’s CAT Score and percentile among all test-takers. Above article explains the CAT scoring and percentile calculation method followed by IIM CAT. CAT 2025 exam was held on Nov 30, 2025. CAT 2025 exam paper difficulty level was higher than last year. Accordingly, updated and latest CAT Score Vs Percentile 2025 Slot Wise estimates by India’s Top CAT Coaching companies like IMS, CL, Arun Sharma (CAT books author), Rajesh Balasubramanian (2IIM) and others are published in this article. According to IMS Coaching, to get 99 Percentile, required score in Slot 1 is 90 - but in Slot 2 it is 83 (7 Marks less). Check details in the article below. After checking details of score and percentile, check how to calculate your CAT score using CAT 2025 Score Vs Percentile Predictor.
Also Read: | |
|---|---|